


D.2.4.1 Protocol/guide for in-situ soil moisture measurements
For plant nutrition, what matters is not so much the total amount of water, but rather the force with which it is retained by the soil. A clay soil may contain a high percentage of water, but the retention force (suction) can exceed the absorption capacity of the roots, making the water unavailable to plants. Conversely, a sandy soil may have a much lower water percentage than a clay soil, yet because the retention force (suction) is weaker, the water is easily absorbed by plants. Thus, at the same percentage of soil moisture, water may be deficient in clay soils and excessive in sandy soils.
For this reason, it is necessary to analyse soil moisture values in comparison with hydrophysical indices, which define the accessibility of water to plants.
The main indicators of soil moisture status are:
The hygroscopic coefficient depends on the extent of the contact surface between soil and water, that is, on soil texture. The maximum values of this index are approximately 1% for sandy soils, up to 8% for loamy soils, and up to 14% for clay soils.
Since the hygroscopic coefficient can only be determined under laboratory conditions, it is recommended that this analysis be performed by the County Agrochemical and Pedological Laboratories. The value of this index is used to indirectly calculate the wilting coefficient.
𝑊𝑃 = 1,5 × 𝐻C
The value of the wilting coefficient is determined by the soil texture: in sandy soils it can reach up to 2%, in loamy soils up to 12%, and in clay soils up to 24%.
The direct determination of the field capacity is done by saturating a delimited portion of soil and measuring its moisture content after the excess water has drained away.
A horizontal platform of approximately 2 m² is isolated either by a wooden or metal frame inserted into the soil to a depth of 20–30 cm, or by a small earth ridge about 10–15 cm high. A quantity of water ranging between 300 L/m² (for sandy soils) and 900 L/m² (for clay soils) is then applied to the enclosed area.
After the water has infiltrated, the platform is covered to prevent evaporation, and after a set period of time — 36 hours for sandy and loamy soils, and 60 hours for clay soils — the soil moisture is determined. This value represents the field capacity.
For indirect estimation, calculation relationships have been developed based on the clay content or the hygroscopic coefficient values for different soil types in Romania (Canarache et al., 1990).
The magnitude of field capacity varies according to texture: up to 6% in sandy soils, up to 32% in loamy soils, and up to 42% in clay soils.
A𝑊C = FC − WP
The available water capacity varies from soil to soil, depending on the same factors that influence field capacity and wilting coefficient. In sandy soils, it can reach values of up to 4%, in loamy soils up to 20%, and in clayey soils up to 18%. The decrease of available water capacity in clayey soils compared to loamy soils is explained by the fact that, as the clay content increases, the wilting coefficient increases more than the field capacity. The values of the hydro-physical indices are indicative and are expressed in weight percent (g%).
In current practice, available water capacity values are presented in millimetres (mm) or cubic meters per hectare (m³/ha).
The AWC data obtained by direct calculation (Fc-WP) as weight percentages do not provide an accurate picture of the actual moisture resources available in the soil, making it necessary to convert these values into mm or m³/ha. For this, it is essential to know the most important physical property of the soil, the bulk density.
Wd = Weight of dry soil (g)
Vd = Total volume of dry soil
Soil moisture (m3/ha) is measured directly in winter wheat and maize crops, respectively depths of 0-20 cm, 0-50 cm, 0-100 cm depending on the stage of growth and development of the plants throughout the active vegetation period. Soil moisture determinations are carried out decadically starting from 28(29) February until 30 November. Observations on soil moisture are carried out throughout the agricultural year, except during the vegetative rest period (December-February).
For each agricultural crop under observation, one soil moisture observation platform is established (one platform for winter wheat crop and one platform for maize crop). Within each platform, samples are taken from 4 points, so that their average provides data on the soil moisture content at the level of the entire platform under continuous observation. In the observation platforms, sampling is done along the plant row. Each new sampling should be conducted 1 meter away from the previous one.
The soil moisture measurement system must be mobile and composed of: measuring probe and hygrometer, extension tube for inserting the sample probe, spiral-auger for soil and data logger for reading soil moisture values at different calendar dates and soil depths depending on the operational data flow during the active vegetation period of agricultural crops (February 28/29- November 30). Every decade, the observer goes into the field to the place where the agrometeorological platforms are located and with the help of the portable system makes determinations regarding soil moisture on soil profiles established in accordance with the methodology for measuring this parameter.
Soil sampling is done decadically, in the last days of each decade (9-10, 19-20 and 28/29-31). If precipitation falls on the day of sampling, measurements are postponed to the next day.
Besides the regular ten-day sampling, additional samples must be collected on the day of sowing and on the day of harvesting the respective crop. Also, after harvesting, the determinations continue every ten days in the plowed field. If the crop to be sown is unknown, the following notations should be used:
a) autumn field no. 1
b) autumn field no. 2
If platforms/hygrometers cannot be directly installed, best-available data from third parties will be used.
As an example, In Romania, for the purpose of continuously monitoring soil moisture conditions in the agricultural regions of Romania, the meteorological network operates 68 stations uniformly distributed across the agricultural territory, each equipped with a complete soil moisture determination program. For soil moisture measurements at stations with agrometeorological programs, portable systems are used — specifically, the Theta Probe ML2x/d and the Stevens Water Field POGO System (including the “Hydra Probe” sensor and the “Stevens Water Hydramon App” for tablet use).
Portable system for soil moisture measurement includes the following:
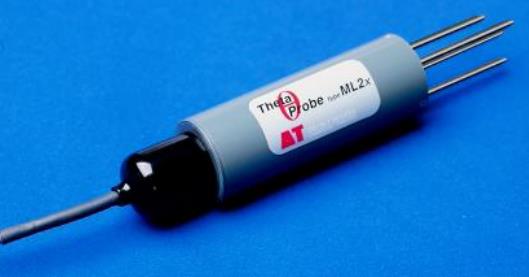
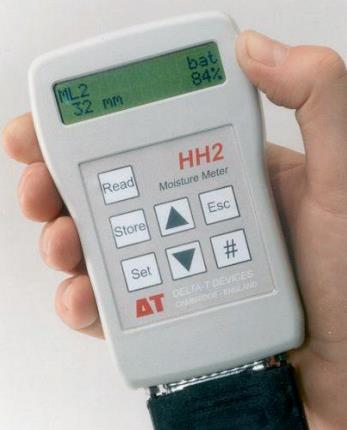
The device is delivered in standard configuration with a portable moisture meter, a probe sensor, with a 2 m long cable, a soil positioning and penetration system, an extension tube for inserting the probe sensor at 100 cm, a soil penetration spiral with a diameter of 45 mm and length of 1.2 m, an user manual, and a carrying case, figure 3.
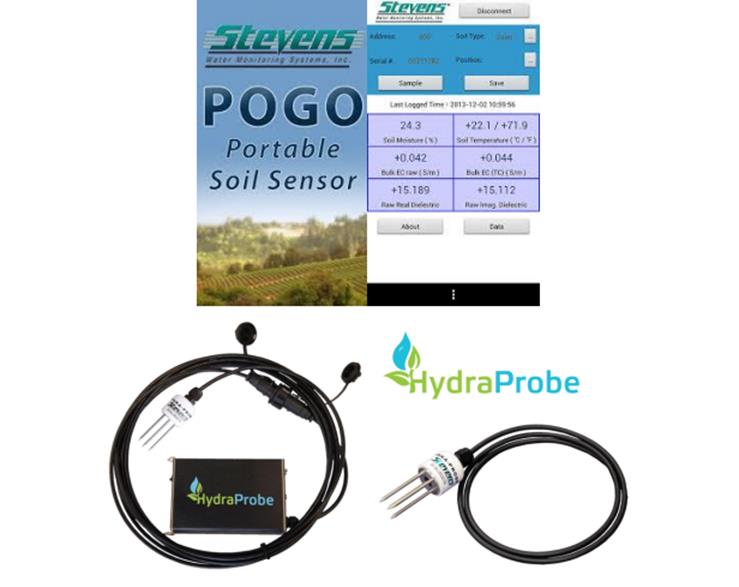
When going out into the field, the observer must take with them: the probe, the humidity sensor, the data logger, and the tablet.
In the agrometeorological bulletins, the available water capacity is expressed in mm or m³/ha for different soil depths: 0–20 cm, 0–50 cm, and 0–100 cm. The following formula is used to calculate it:
A𝑊C = (𝐹C − 𝑊𝑃) . 0,1 . BD . D
FC – field capacity (expressed in g%)
WP – wilting point (expressed in g%) BD – bulk density (g/cm³)
D – depth of the soil horizon (cm)
The expression of AWC in m³/ha is given by the formula:
AWC (mm) x 100 = AWC (m3 ⁄ ha)
During the growing season, the available water varies depending on the increase in evapotranspiration and the amount of recorded precipitation. Its calculation at different dates is done using the following formula:
Significant moisture (mm) = (Ug – WP) . 0,1 . BD . D
where: Ug – current moisture obtained from direct measurement.
In agrometeorological bulletins, for a complete overview of soil moisture status, the onset and intensification of drought are presented through existing soil moisture deficits, expressed either as a percentage of AWC and calculated using the formula:
Deficit % AWC = Current available soil moisture (mm) / AWC (mm) x 100
Presenting the deficits in this form is the most suitable for determining the timing of irrigation applications. The values thus obtained characterize the degree of soil water supply, the accessibility of water for plants, as well as the intensification of soil drought according to Table 1.
Table 1
| Degree of water accessibility for plants | Light and medium soils | Heavy soils |
|---|---|---|
| Very difficult conditions for water accessibility for plants (water very hard to access) – extreme drought | 0 – 20 %AWC | 0 – 25 % AWC |
| Conditions ranging from difficult to satisfactory for water accessibility for plants (water hard to access) – severe drought; | 20 – 25% AWC | 25 – 40 % AWC |
| Conditions from satisfactory to favourable for water accessibility for plants (water easily accessible) – moderate drought | 25 – 50 % AWC | 40 – 60 %AWC |
| Optimal conditions for water accessibility for plants (water very easily accessible). | 50 – 90% AWC | 60 – 85% AWC |
| Optimal conditions for water accessibility for plants, but during this period, they suffer from insufficient air in the soil. | 90-100% AWC | 85-100% AWC |
In order to convert the moisture reserve from percentage expression (% by volume) into cubic meters per hectare (m3/ha), the following calculation steps will be followed:
Soil moisture reserve (m3/ha) = Current soil moisture reserve (m3/ha) — Wilting point WP (m3/ha)
Current Soil Moisture Reserve (m³/ha) = Weighted average of soil moisture across the soil profile (%) × Soil depth (cm)
Weighted average of soil moisture across the soil profile (%) = Average of measured soil moisture values (%) at each soil depth / Total depth of the soil profile (cm)
Finally, the following calculation formula will be applied for the three soil depth intervals (0–20 cm, 0–50 cm, and 0–100 cm), figure 4.

Canarache, A., 1990 – Physics of Agricultural Soils, Ceres Publishing House, Bucharest;
WMO-No.8, Guide to Meteorological Instruments and Methods of Observation (2008 Edition, updated in 2010);
WMO-No.134, Guide to Agricultural Meteorological Practices (2010 Edition);
WMO-No.266, Compendium of Lecture Notes for Training Class IV Meteorological Personnel. Vol. II: Meteorology (1984 Edition);
WMO-No.544, Manual on the Global Observing System. Vol. I (2003 Edition);
WMO-No.551, Lecture Notes for Training Agricultural Meteorological Personnel (2001 Edition);
Mateescu E., Alexandru D., Oprea O.A., Manea A., (2016), Agrometeorological Guide, National Meteorological Administration;
***Agrometeorological database of the National Meteorological Administration, managed by the Agrometeorology Department.