


D.1.6.1 Standardised protocol for phenological observations
Agrometeorology is the science that studies meteorological conditions in terms of their influence on agricultural production. According to WMO Guide No. 134, agrometeorology investigates meteorological, hydrological, pedological (soil-related), and biological factors that affect agricultural output, as well as the interactions between the environment and agriculture. The main goal of this science is to understand all these effects to assist farmers by applying new knowledge from research to agricultural practices. Operational agrometeorology focuses on small-scale climate changes caused by windbreak systems, irrigation, mulching, shading, and actions to protect crops from frost and hail. The WMO guide also highlights the critical role of agrometeorology in today’s context of climate change, particularly in preparing for and adapting to its impacts on human society, such as:
Depending on the location where agrometeorological measurements and observations are carried out and the specifics of the agrometeorological observations and determinations program, we distinguish:
Standard platforms are well-defined areas of a specific crop where observations and determinations are made according to a schedule of 2 times a week. In production field platforms, a minimal schedule is executed where the same observations and determinations are made once a week.
Visual assessments of the soil condition refer to:
Biological determinations include:
Phenological observations are carried out in standard platforms and in production fields.
The standard observation platform has an area of 1 ha (100/100 m) and is divided into 4 plots.
The observation points will be chosen in the four corners of the platform and marked with stakes. The central area is intended for determining production elements.
It is desirable that agrometeorological platforms be located in plots with as large an area as possible (>10 ha in the plain area and >3 ha in the hill area).
If such possibilities do not exist, the platforms can also be fixed on smaller plots, provided that the homogeneity imposed by the soil and relief is respected. In these conditions, the following requirements will also be taken into account:
The measurements on the height of the winter wheat stem are performed on the same number of plants as in the phenological observations, starting from the 8th day after the mass initiation of the straw elongation phase. Then the determinations are repeated twice a week, together with the phenological observations, until mass flowering (50%). The next height determination is made 8 days later (after 50% flowering).
The last measurement of the plant height is made in the full maturity phase, parallel to the determination of the production elements.
The height of the maize (cm) will be measured on the 40 typical plants (10 from each plot of the platform).
The determinations will be made twice a week starting from the appearance of the 10th leaf (50%) until the 5th day after panicle flowering.
During the leafing period, the plant height is measured from the ground level to the tip of the longest leaf. After the panicle has bloomed, the measurement will start from the ground level to the tip of the panicle.
The extended BBCH (Biologische Bundesanstalt Bundessortenamt and CHemical industry) scale is a standardized system designed to uniformly describe the phenological growth stages of both monocot and dicot plant species (cf. Meier, 2018).
It was developed through a collaborative effort involving the German Federal Biological Research Centre for Agriculture and Forestry (BBA), the Federal Office of Plant Varieties (BSA), the German Agrochemical Association (IVA), and the Institute for Vegetables and Ornamentals in Grossbeeren/Erfurt (IGZ) (Meier, 2001).
The BBCH scale is a harmonized decimal code that assigns every observable phenological event in the life cycle of crop development, from germination to tillering, stem elongation, flowering, grain filling, and senescence, into two digits from 00 to 99, enabling agronomists, regulators, and farmers to communicate growth stages with laboratory precision. For winter wheat in the Danube region, the scale allows managers to record that sowing typically occurs at BBCH 00-01 in early October, tillering peaks around BBCH 25 by late November, stem elongation reaches BBCH 31-39 in March to early April, heading completes at BBCH 59 in mid-May, and grain development progresses through BBCH 71-89 into July, guiding time-critical fungicide, nitrogen, and irrigation decisions. Maize, commonly sown after frost risk (e.g. in late April), emerges at BBCH 10-12 by early May, attains BBCH 51-59 tasseling in July, achieves BBCH 75-85 grain filling in August-September, and ends at BBCH 99 physiological maturity before October, letting producers synchronize weed control, fertilization, and harvest logistics with regional heat-unit accumulation and Danube flood- risk patterns (Hack et al., 1992; Meier, 2018).
The basic principles of the BBCH scale are as follows:
The entire plant development cycle is divided into ten recognized developmental phases and can be organized over a longer period. These main growth stages are described using numbers in ascending order from 0 to 9.
Where two or more main growth stages occur in parallel, both may be indicated using a single code. When only one stage is indicated, either the more advanced growth stage should be chosen or the main growth stage is of particular interest, depending on the plant species.
The main growth stages are not sufficient to define the exact application or evaluation of production data, as they always describe time intervals during the development of a plant.
BBCH observations for winter wheat and maize should be captured under the following rolling, site-based protocol, potentially pairing fixed “sentinel” fields with ad-hoc replacement fields. At each location, trained observers, drones, or on-site photography logs BBCH codes every 7 to 10 days (optimum that may not always be practicable), with the goal of documenting the canopy and its development, supplemented by ancillary data, that is, sowing date and soil moisture. When a field is fallow, flooded, harvested, or cannot be assessed in the target interval, the observer flags the gap. In addition, remote-sensing feeds from Sentinel-2 or PlanetScope can provide continuous spectral indices that corroborate ground truth and retrospectively interpolate missing BBCH stages, which will be managed by Meteo Romania. The maximum target observation period ranges from July/August 2025 through spring 2027 for both crop types (i.e. winter wheat and maize), while the minimum observation period is from March 2026 through October 2026 for at least one of the crop types (i.e. winter wheat or maize). The grain-specific paragraphs lay out the most relevant observations to be documented, and the last section presents a simplified workflow to ensure possibly gap-free data collection through remote sensing. The minimal set of BBCHs can be supplemented by suitable intermediate stages. If the observation period is a week, and the key stages might not be visible, the observed intermediate BBCH codes instead must be noted.
Phenological observations should be made on a fixed number of typical plants, which are maintained throughout the entire growing season. The number of typical plants (which should be representative of the majority of plants in the respective crop) differs depending on the crop. Thus, for field crops, 10 plants are selected in each plot.
Phenological phases are recorded in the register as follows:
Determining the nature and degree of plant damage caused by these phenomena is of particular importance for informing about the damage caused and for studying the possibility of the occurrence of harmful phenomena in different regions of the country, this information being useful in taking appropriate measures to protect crops.
The main elements for evidence of the influence of meteorological phenomena harmful to agricultural plants are the following:
In addition to the characterization of the damage, the degree of surface damage and the particularities of the place where the damage was found, the following aspects are also mentioned:
In the winter period, damage can be reported to the autumn cereals, including winter wheat.
Frostbite occurs due to low temperatures, in the absence of snow cover or when this layer is not thick enough during severe frosts. At first, the tip of the leaves freezes, then the entire leaf and finally the twinning node. In terms of external appearance, frozen plants remain green, but after thawing they turn yellow and dry up. In the case of partial damage to the twinning node, after the temperature starts to rise, a false resumption of vegetation is observed. The leaves turn green for a short time at the expense of the living parts of the plant, but later they wither and die entirely.
Asphyxiation – In the case of a long-term maintenance of a thick layer of snow on thawed soil, conditions are created for intense respiration of plants, which causes the weakening of the entire organism. This creates favourable conditions for the appearance of snow mould and other fungi, the immediate effect being partial damage to the foliar apparatus or the total disappearance of the plants. In terms of external appearance, the damaged plants have a grey-brown colour, and the leaves are rotten.
In the case of snow mould, a grey or white spider web-like layer appears on the leaves.
There are two types of ice crust: crust attached to the ground and crusted snow. Generally, when crusted snow is short-lived, it does not have a negative impact on crops. In the case of crusted ice, plant damage or complete destruction of autumn crops is often observed.
Crops dislodgement usually occurs towards the end of winter due to repeated freezing and thawing. By freezing, the water infiltrated into the soil increases its volume and lifts the surface layer of the soil together with the plants, causing the roots to break. Thus, the twinning node remains on the soil surface, the plants become sensitive to the unfavourable conditions of the following period and easily perish. To avoid this phenomenon, the agrotechnical norms from sowing must be strictly observed. In the case of sowing in fresh ploughing, successive freezing and thawing have a much more pronounced harmful effect on the plants than in the case of sowing in a soil ploughed well before sowing.
The crop drying occurs in the spring, when the roots are still in the frozen soil and the aerial parts begin to vegetate due to the high temperature at the soil surface. In this case, the roots cannot absorb the water necessary for transpiration, the plants begin to suffer from the lack of water, they wither and dry out partially or completely.
Crops dislodgement due to wind occurs in winters with little snow and under the influence of strong winds. The twinning nodes become bare and are damaged by frost.
Damage caused during the growing season
Frosts can occur in late spring, after plant emergence, or in autumn before harvest, causing crop sensitization. After thawing, leaves quickly lose their green colour and wither; damaged grains lose their elasticity. If wheat and barley have not completed their grain formation phase, damaged leaves and ears turn yellow immediately after thawing, resembling ripe ones. In this case, the grains do not turn yellow anymore and after drying they are underdeveloped, the chaff is brittle, and the grains do not continue their growth and maturation processes.
The effect of drought and dry wind (hot wind) occurs during dry periods, when the water reserve in the soil is low or on hot days, accompanied by wind, with low relative air humidity (<30%). The visible signs that the plants have begun to suffer are the following:
Hot and dry winds, in conditions of insufficient humidity, can cause the drying of the grains that have not completed their formation process.
During the observations, the duration and intensity of the phenomenon (hail and heavy rain) will be recorded: hail size, amount of precipitation, maximum wind speed.
Asphyxiation occurs especially on clay soils due to the stagnation of water from melting snow or rain.
| No. | Phenological phase | Phenological code |
|---|---|---|
| 1. | Dry seed (caryopsis) | 00 |
| 2. | Radicle emerged from caryopsis (Germination) | 05 |
| 3. | First leaf through coleoptile | 10 |
| 4. | 3 leaves unfolded | 13 |
| 5. | Beginning of tillering: first tiller detectable | 21 |
| 6. | End of tillering. Maximum no. of tillers detectable | 29 |
| 7. | Stages continuous till (Vegetative rest) | * |
| 8. | Beginning of stem elongation: pseudostem and tillers erect, first internode begins to elongate, top of inflorescence at least 1 cm above tillering node | 30 |
| 9. | Beginning of heading: tip of inflorescence emerged from sheath, first spikelet just visible | 51 |
| 10. | Beginning of flowering: first anthers visible | 61 |
| 11. | Medium milk: grain content milky, grains reached final size, still green | 75 |
| 12. | Hard dough: grain content solid. Fingernail impression held | 87 |
| 13. | Fully ripe: grain hard, difficult to divide with thumbnail | 89 |
| 14. | Harvested product | 99 |
For winter wheat, phenological observations are ideally carried out from the date of sowing until harvest.
The following physical characteristics and geographical and biological data on the date of sowing should be collected:
During the growing season, the following phenological phases will be targeted:
In the germination phase, the embryo begins to grow, breaks through the seed coat, releasing the radicle and the bud.
Observations to record the germination phase are made three times a week. The first observation will be made two days after the sowing date.
To control germination, two surveys will be carried out in each plot of the observation platform, with a total of eight surveys on the entire platform. For this, in two points of the plot, on a randomly chosen row, the seeds are dug up at a distance of 1.5 times greater than the sowing distance, between the grains, then it is monitored whether or not the seeds are germinated in he respective surveys (regardless of the number of seeds). The survey where germinated seeds were found is marked with 1, and the one without germinated seeds is marked with 0.
The data resulting from the observations are noted in the register, for each plot, and in the column “percentages (%)” the percentage represented by the number of surveys where germinated seeds were found compared to the total of 8 surveys carried out on the platform is entered. Table 1 helps to calculate the percentages of evolution of the germination phase:
Table 1. Example of calculating the percentage of germinated seeds
| No. of surveys where germinated seeds were found | % |
|---|---|
| 1. | 12.5 |
| 2. | 25.0 |
| 3. | 37.5 |
| 4. | 50.0 |
| 5. | 62.5 |
| 6. | 75.0 |
| 7. | 87.5 |
| 8. | 100.0 |
A hypothetical example of recording survey results is presented in Table 2.
Table 2. Example of calculating the percentage of germinated seeds
| Date | Phenological phase | No. of plants in phase (in the 4 plots) | % | Obs. | |||
|---|---|---|---|---|---|---|---|
| 1 | 2 | 3 | 4 | ||||
| 02.10. | Germination | – | 1 | – | 1 | 25.0 | – |
| 10.10. | Germination | 2 | 2 | 2 | 2 | 100.0 | – |
Figure 1. First leaf through coleoptile
The moment of triggering the emergence phase is considered when the first leaf appears on the soil surface, its color becoming green, figure 1.
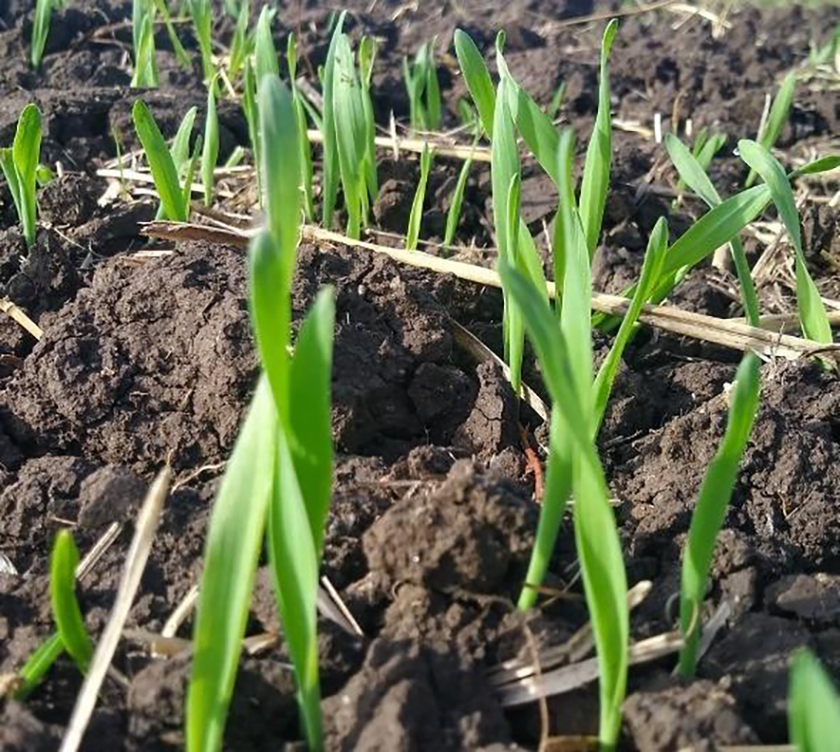
When 3-4 plants have sprouted and reached 2 cm in height, the “beginning of the phase” is estimated in electronic format without mentioning the number of plants in the phase. The notation “beginning of the phase” is mentioned until the rows are outlined. After installing the metric frames, observations are made only on the plants inside it (microplot), if available. The observations will be approximated by counting the number of plants, and registered in electronic format according to the model in Table 3.
Table 3. First leaf through coleoptile observation
| Date | Phenological phase | No. of plants in phase (4 microplots) | % | Observation | |||
|---|---|---|---|---|---|---|---|
| 18.10.76 | sowing | ||||||
| 20.10.76 | sowing | ||||||
| 22.10.76 | |||||||
| 24.10.76 | the beginning of emergence | ||||||
| 26.10.76 | |||||||
| 28.10.76 | First leaf through coleoptile | 12 | 20 | 21 | 11 | 3.4 | |
| 31.10.76 | 15 | 25 | 30 | 15 | 4.4 | ||
| 2.11.76 | 35 | 41 | 65 | 38 | 9.7 | ||
| 4.11.76 | 79 | 90 | 123 | 84 | 19.8 | ||
| 12.11.76 | 425 | 486 | 524 | 465 | 100.0 | ||
| 14.11.76 | 426 | 485 | 523 | 464 | 100.0 | ||
| 16.11.76 | 424 | 483 | 525 | 463 | 100.0 | ||
The thermal index at emergence will also be calculated (© T >0°C from the date of sowing to 50% of the phase and until the end of emergence) and will be noted in the observations column if necessary.
This phase is characterized by the appearance and elongation of the 3rd leaf up to 2 cm in length.
Observations are made on plants in the microplots in which the rate of evolution of the emergence phase was monitored. The results are recorded in the register, the percentages being calculated in relation to the number of plants / sqm at the end of the emergence phase. When half of the plants on the microplot are in the three-leaf phase, and the number of plants / sqm is relatively constant, 10 typical plants are individualized near each microplot (with the same number of leaves, the same height, the same vigour, etc.).
Plants can be chosen in a single row (10 plants) or in two neighbouring rows (5 + 5 plants). The other phenological observations that follow the three-leaf phase will be made on these typical plants.
Twinning is the biological process by which lateral shoots are formed. The siblings start from the twinning node and develop in the same way as the main stem: the secondary roots also form from the twinning node.
The results of the observations are entered in the table and the thermal index of twinning is
calculated (ΣT >0°C from the date of sowing to 50% of the phase and 100% of the current phase).
If twinning is not completed before the plant enters dormancy, for the winter months, quantifiable
“warm windows” will be noted and marked until the vegetation resumes.
Also, for the winter period, each cessation and resumption of vegetation will be noted / approximated.
The definitive resumption of vegetation in spring consists of the resumption of growth; the upper leaves begin to elongate, with fresh green tissue visible on their upper part. This date will be noted in electronic format, depending on its availability.
When studying the impact of winter conditions on wheat, a microplot (different from the one on which the density is made), if available, will be chosen on the platform on which the following observations will be highlighted:
These determinations aim to estimate the positive or negative effects that weather conditions have during the cold period on plants.
The nature and degree of intensity of the damage, the surface, the cause and the date of occurrence of the phenomenon will be noted, if occurring, in the special section:
The stem elongation phase begins when the basal node on the main stem becomes visible and the first internode reaches a length of 2 cm.
The nodes of the stem are hidden beneath the leaf sheath, but they can be easily felt by pressing between the fingers. If the phase cannot be investigated using this method, a surrogate method will be used, that is, expert assessment or longitudinally sectioning the stem with a blade or knife.
Since this phase coincides with the appearance and formation of the double ridge, which includes the reproductive organs, special attention should be given to the date of occurrence at different percentages. Additionally, contingent on data availability, any meteorological risk phenomena should be noted in the special section, such as consecutive days with temperatures below 8°C and high cloudiness, heavy rainfall, or precipitation deficits.
With the onset of the stem elongation phase, the generative stage begins (differentiation of reproductive organs). At the same time, the growth rate is very pronounced in spring, when in about 90 days over 90% of the total biomass of the plants is typically accumulated, as illustrated in Table 4.
Table 4. Biomass growth (aboveground part) in autumn wheat (dry weight of 100 plants)
| Sample Collection Date | Dry biomass (g) | % of Total Biomass | Growth Increment (g) | Growth Increment (%) |
|---|---|---|---|---|
| 14.III | 5,2 | 1,7 | – | 1,7 |
| 30.III | 9,9 | 3,2 | 4,7 | 1,5 |
| 11.IV | 21,32 | 6,9 | 11,7 | 3,7 |
| 20.V | 29,9 | 9,7 | 8,6 | 2,8 |
| 2.V | 64,1 | 20,9 | 34,2 | 11,2 |
| 9.V | 107,6 | 35,1 | 43,5 | 14,2 |
| 16.V | 163,5 | 53,4 | 55,9 | 18,3 |
| 23.V | 206,9 | 67,6 | 43,4 | 14,2 |
| 30.V | 228,0 | 74,5 | 21,1 | 6,9 |
| 6.VI | 260,0 | 84,9 | 32,0 | 10,4 |
| 13.VI | 288,0 | 94,1 | 28,0 | 9,2 |
| 20.VI | 300,0 | 98,0 | 12,0 | 3,9 |
| 27.VI | 306,0 | 100,0 | 6,0 | 2,0 |
Simultaneously with the elongation of the stem, the spike also grows under the protection of the leaf sheath. Before emergence, the sheath of the last leaf is more voluminous, resembling a boot due to the inflorescence it protects, which is typically almost fully developed at this stage. At this point, the plants are considered to be in the booting stage. The date of this phase’s occurrence, if present under the local conditions and farming practices, is recorded, ideally noting percentages of 10%, 50%, and 100%.
The last uppermost leaf, also known as the flag leaf, is of particular importance for wheat grain production. The number of grains in the spike and their weight are positively influenced by the assimilation surface of this leaf. Therefore, during this phase, if it is possible,, the surface area of the flag leaf is measured to calculate the leaf area index.
This phase is considered when half of the spike has emerged from the sheath of the last leaf.
Observations consist of counting the plants that have entered the heading phase, specifically the main stems of the above-selected 10 plants in each plot for phenological observations.
The main stems are easily distinguished from the others by their size, height, and stage of development.
The number of plants that have entered the phase is recorded, in an electronic register with absolute values, and the percentage of the phase is then calculated.
The flowering phase is observed in the central part of the spike, on the main stems, when the first flowers have opened.
Flowering occurs within 3-5 days after heading, lasts on average 5-7 days, and first takes place in the spikes of the main stem.
This phase is particularly important in the wheat growth cycle because the evolution of weather conditions during this period determines the yield.
For this reason, all meteorological phenomena that could jeopardize the optimal progression of this phase (temperatures below 10°C and above 35°C, heavy rainfall, drought) should be recorded during this phase.
During this period, the spike grows very rapidly, the root system is supplemented with additional roots, and the depth of root penetration substantiates. At the same time, the rate of vegetative biomass accumulation decreases.
Observations will be optimally made on the same above-selected 10 plants, and the results will be recorded in the register in electronic format (Table 5).
Table 5. Calculating the percentages of the flowering phase during phenological observations on 40 plants
| Number of plants | % | Number of plants | % | Number of plants | % | Number of plants | % |
|---|---|---|---|---|---|---|---|
| 1 | 2.5 | 11 | 27.5 | 21 | 52.5 | 31 | 77.5 |
| 2 | 5.0 | 12 | 30.0 | 22 | 55.0 | 32 | 80.0 |
| 3 | 7.5 | 13 | 32.5 | 23 | 57.5 | 33 | 83.5 |
| 4 | 10.0 | 14 | 35.0 | 24 | 60.0 | 34 | 85.0 |
| 5 | 12.5 | 15 | 37.5 | 25 | 62.5 | 35 | 87.5 |
| 6 | 15.0 | 16 | 40.0 | 26 | 65.0 | 36 | 90.0 |
| 7 | 17.5 | 17 | 42.5 | 27 | 67.5 | 37 | 92.5 |
| 8 | 20.0 | 18 | 45.0 | 28 | 70.0 | 38 | 95.0 |
| 9 | 22.5 | 19 | 47.5 | 29 | 72.5 | 39 | 97.5 |
| 10 | 25.0 | 20 | 50.0 | 30 | 75.0 | 40 | 100.0 |
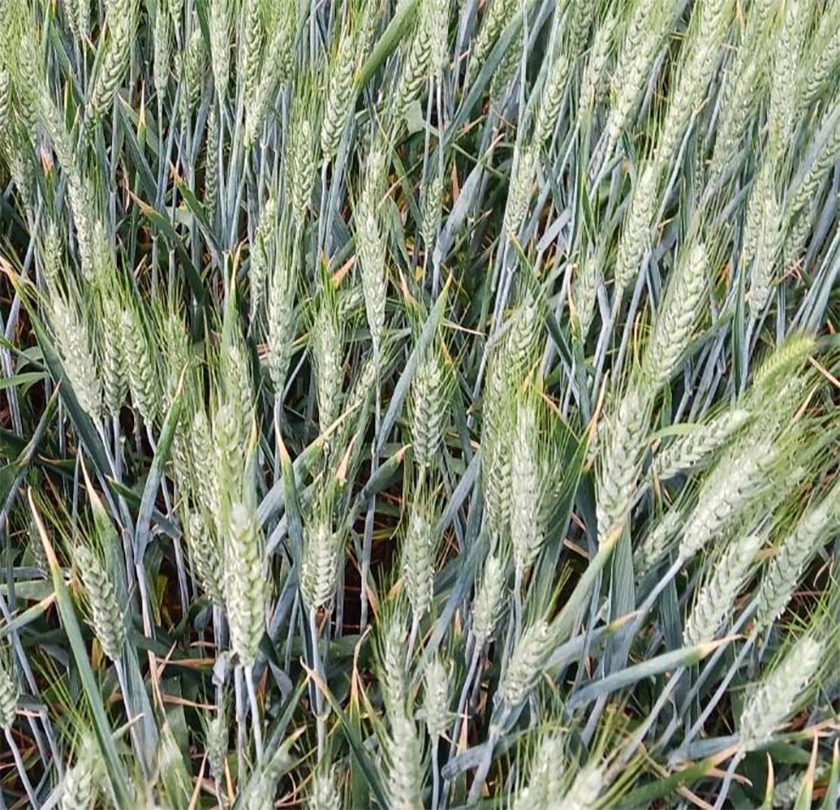
It corresponds to the milk and hard dough maturity stages, Figure 2.
Grain maturity begins in the middle of the spike and continues towards the tips, first on the main stem and then extending to the lateral stems.
At the beginning of this phase, the plants are still green, with only the basal leaves beginning to change color. Each leaf starts drying from the tip towards the sheath. The nodes on the stem are still elastic and turgid, but the ones at the base begin to wilt.
In the milk maturity phase, the grains are still green and filled with a milky liquid.
Observations will be made only on the spikes of the main stem. Plants will be possibly counted and recorded in this phase, in the electronic register, either with absolute values or percentages that may also be derived from imagery.
Tests to verify the onset of this phase will be performed only on grains from the middle of the spike.
When the grains from the middle of the spike turn yellow, the plants enter the wax maturity phase. The grain content can be pierced with a fingernail. The absorption of nutrients in the grain decreases, and the stem turns yellow. The stem, except for the upper internodes, is yellow but still elastic. The leaves have dried, and some of them have become brittle. The process of accumulating organic substances in the grain stops.
The grain hardens, no longer being able to be pierced with a fingernail, and begins to lose water, Figure 3.
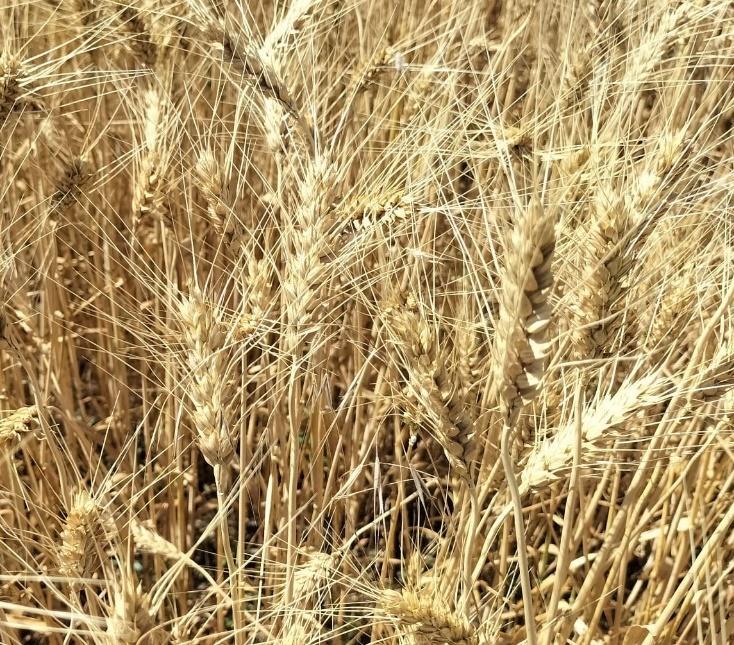
When the water content reaches 14-15%, technological / full maturity is reached. The crop can be harvested. At best, the determination of the phase is done in the same way as for the milk and wax maturity stages, and the observations are recorded in the electronic register. Additionally, the harvest date, method of harvesting, and the yield obtained are noted as available from ASPs.
The winter wheat crop can be affected by the diseases presented in Table 6.
Table 6. Winter wheat crop diseases
| Name of the disease | Phenological stage of emergence | Symptoms | Damage caused |
|---|---|---|---|
| Powdery mildew – Erysiphe graminis | Any phenological stage | It appears on all aerial plant organs, most frequently on the leaves. Grayish-white spots develop, which over time give the plant a powdery appearance. | Yield losses |
| Yellow rust of wheat – Puccinia striiformis | Flowering + grain filling stages | Bright yellow streaks between the leaf veins, on stems, rachis, and awns. | Negatively affects plant development, vigor, and grain filling. |
| Snow mold – Fusarium nivale | Tillering stage | The appearance of a pink mycelial mat on the leaves after snow melts. | Browning and drying of the leaves |
| Septoria leaf blotch – Septoria sp. | Throughout the entire growing season | Chlorotic spots that necrotize and spread over the entire foliage, straw, and ears. | Shriveling of the grains that mix with the chaff and are lost at harvest. |
| Fusarium head blight of wheat – Fusarium sp. | Heading – maturity | Reddening or whitening of the ears. Before flowering, ears remain sterile. After flowering, grains remain shriveled. | Pierderi de recoltă datorită sterilităţii florilor şi slabei umpleri a boabelor. |
| Common bunt of wheat – Tilletia sp | Heading stage | The color of the ears and leaves turns bluish-green. Ears become thin, and the grains have a grayish- brown color. | Yield losses due to flower sterility and poor grain filling. |
| Blackening of the ears or black mold | Maturity – harvest | Blackening of the grains | Significant yield losses occur in areas where ripening and harvesting are delayed due to wet and rainy weather. |
The winter wheat crop can be affected by the pests presented in Table 7.
Table 7. Winter wheat crop pests
| Pest name | Sensitive growth stage | Affected plant organs | Damage caused |
|---|---|---|---|
| Cereal bug (Eurigaster sp.) | Heading; grain filling | Adults and larvae feed on all plant organs | The greatest damage occurs to the grains: they lose their baking quality |
| Wireworms (Agriotes sp.) | Leaf development stage | Young leaves show wilting and yellowing symptoms | Loss of vegetative biomass |
| Cereal leaf beetle (Zabrus tenebroides) | Throughout the entire vegetative cycle, especially during grain formation | Leaves and grains. Attacks occur in patches or are widespread | Plants destroyed, yield loss. |
| Steppe beetle (Anoxia villosa) | Stem elongation; heading; grain filling | Aerial parts, reproductive organs | Delays in development, sterility, reduced plant height, decreased grain yield. |
| Cereal beetles (Anisoplia sp.) | Maturity, milk, wax stages | Grains | The greatest damage occurs to the grains; they can be completely destroyed. |
| Wheat stem sawfly (Cephus pygneus) | Stem elongation; heading; grain filling | Stems and grains | Stem breakage and ear lodging. Reduction in grain weight. |
| Cutworm (Scotia sp.) | Emergence – tillering | Young stands are cut off, dry out, and gaps appear in the crops | In years with devastating invasions, damage covers large surfaces. |
| Red gall midge (Hoplodiplosis marginata) | Stem formation and elongation; heading | Stems affected by destruction of vascular tissues | Stunting of heading, premature ripening, or even complete destruction of plants. |
| Cereal leaf miner (Oscinella frit) | 2-3 leaf stage – heading | The central leaves are attacked. During the heading stage, it attacks the flowers, causing them to abort. | Complete death of the plants, yellowing and drying of the ear. The greatest damage occurs to plants at the 2-3 leaf stage. |
| European ground squirrel (Citellus citellus) | Maturity | Wheat ears | Cutting of wheat ears, gaps in the field, grains shaken out. |
| European hamster (Cricetus cricetus) | Maturity | Grains | Grains |
| No. | Phenological phase | Phenological code |
|---|---|---|
| 1. | Dry seed (caryopsis) | 00 |
| 2. | Radicle emerged from caryopsis (Germination) | 05 |
| 3. | First leaf through coleoptile | 10 |
| 4. | 3 leaves unfolded | 13 |
| 5. | 9 or more leaves unfolded | 19 |
| 6. | Beginning of stem elongation | 30 |
| 7. | Beginning of tassel emergence: tassel detectable at top of stem | 51 |
| 8. | Male: upper and lower parts of tassel in flower, Female: stigmata fully emerged | 65 |
| 9. | Kernels in middle of cob yellowish-white (variety-dependent), content milky, about 40% dry matter | 75 |
| 10. | Early dough: kernel content soft, about 45% dry matter | 83 |
| 11. | Fully ripe: kernels hard and shiny, about 65% dry matter | 89 |
| 12. | Harvested product | 99 |
The impact of the variation of agrometeorological factors on the genetic code specific to each hybrid is reflected in the external appearance of the plant, the pheno-morphological characteristics specific to each growth and development stage.
In corn cultivation, optimally, phenological observations are made during the following phenological phases, distinct due to their specific features:
For seed germination control, a row is selected from the sowing in each plot of the platform. In this row, two holes should be made at different locations, each with a diameter of approximately 15 cm. If one or more seeds have developed a radicle, this is considered “1” for each sampling. For each quarter of the platform, 0, 1, or 2 is noted depending on the germinated seeds found during the samplings and methods used. The results of the investigations are totaled and recorded in the register in electronic format as percentages (%) as show-cased in the example of Table 8.
Table 8. Germination observation
| Date | Phase | Number of plants in phase in the 4 plots | Plants that have entered the phase (%) | |||
|---|---|---|---|---|---|---|
| 18.04 | Germination | 0 | 1 | 2 | 1 | 50 |
| 20.04 | Germination | 1 | 2 | 2 | 1 | 75 |
| 22.04 | Germination | 2 | 2 | 2 | 1 | 100 |
The germination phase is considered when the coleoptile emerges at the soil surface. Corn germinates 6-10 days after sowing, depending on the soil’s hydrothermal regime.
The beginning of the phase is recorded when the plants reach a height of 2 cm, until the plant rows are clearly visible. Where applicable, using stakes, a 5-meter section of a row should be marked in each plot of the platform. The number of emergent plants is recorded as absolute values, and after the phase ends, the percentages (%) are calculated, if the data is on hand (e.g. provided by the ASP).
The germination phase is considered to be reached in a plot when 50% of the seeds have germinated and the first leaf (curled at the tip) is visible on the soil surface.
The third leaf is formed at the base of the second fully unfolded leaf. This phase is considered when the third leaf reaches a length of 2 cm, Figure 4.
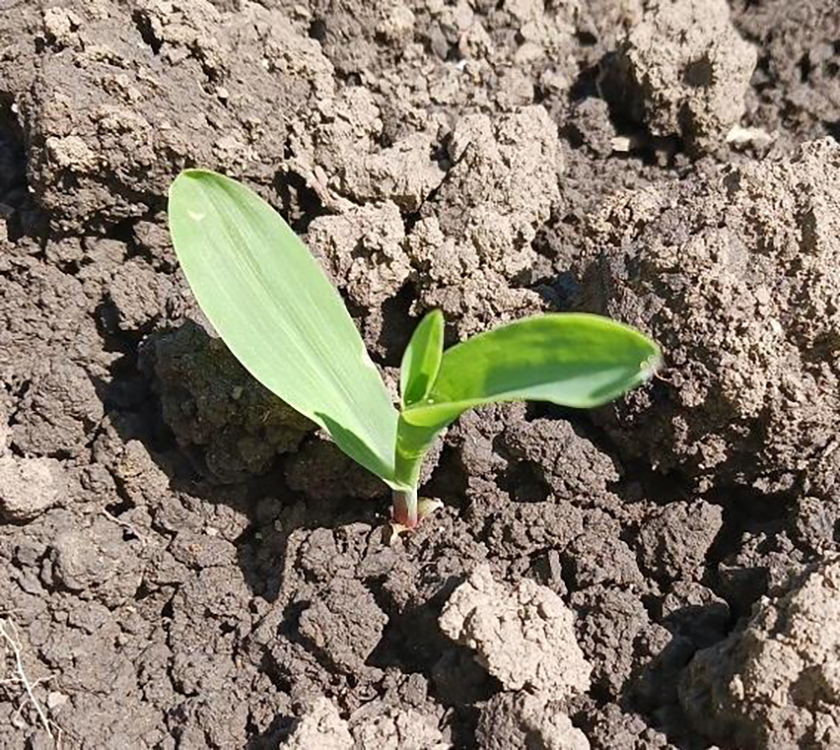
Optimally, observations should be made on the same row sections established during germination. After the completion of this phase (100%), 10 typical plants are selected from each plot of the
platform (from one row or two adjacent rows), and subsequent phenological observations and biometric measurements are made on these 40 selected plants depending on available methods and the ASP.
In this phase, only the average number of leaves, specific to the cultivated hybrid, will be recorded in the register. Depending on the earliness, this number varies between 12-14 for early hybrids and 20-21 for late hybrids, Figure 5.
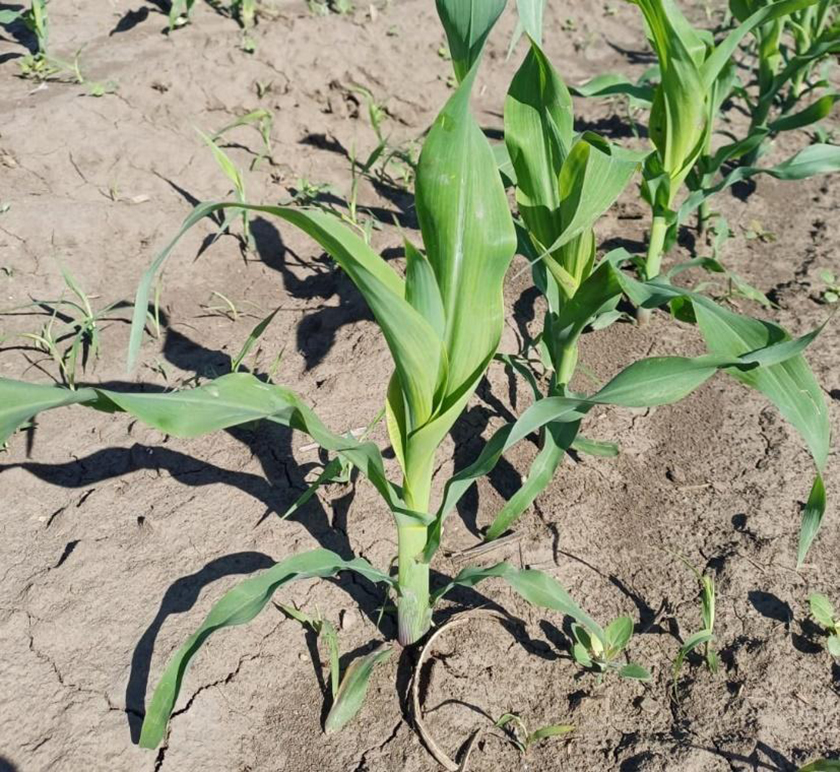
The leafing rate is monitored by counting the leaves, and the results are recorded as absolute values, if attainable. Finally, the percentage of plants that have entered the phase is approximated, as shown in Table 9.
Table 9. Leafing rate monitoring
| Date | Phase | Average number of plants in phase in the 4 plots | Plants that have entered the phase (%) | |||
|---|---|---|---|---|---|---|
| 28.05 | 9 or more leaves unfolded | 12.3 | 11.4 | 10.9 | 9.7 | 11.1 |
Under conditions of water stress or pest and disease attacks, the basal leaves may dry up and fall off. Therefore, after the appearance of the fifth leaf, it is necessary to mark it with a cord, and the results of subsequent observations by indicating the number 5. If relevant, the same procedure applies to the appearance of the tenth leaf for accurate tracking of the leaf count.
The initiation of the panicle is a phenological stage corresponding to the beginning of the differentiation of the apical vegetative meristem (apex) into the male inflorescence (panicle).
The differentiation of the ear (female reproductive organ) follows later.
The initiation of the panicle occurs when the number of visible leaves represents 50% of the total number of leaves characteristic of the cultivated hybrid.
The initiation of the ear (spike) begins approximately one month before flowering, but it is difficult to detect in the field, requiring dissection of the plant.
In electronic format, the calendar dates when the initiation of the panicle and the female inflorescence occur should be recorded.
The panicle is fully formed when the tip is green, and identification should be made by unfolding the upper leaves of the plant.
If attained and accessible within the framework of the applied method, the phase of panicle appearance should be recorded when the upper part of the panicle has emerged from the sheath of the last leaf that has a length of 1.5 – 2 cm.
The appearance of the panicle should be recorded according to the following model (Table 10).
Table 10. Panicle observation
| Date | Phase | Number of cases in the stem elongation phase in the 4 plots | Plants that have entered the phase (%) | |||
|---|---|---|---|---|---|---|
| 7.07 | Beginning of stem elongation | 6 | 8 | 10 | 6 | 75 |
| 8.07 | Beginning of stem elongation | 1 | 2 | 5 | 2 | 25 |
The spikelets of the panicle form the first anthers on long filaments. The pollen grains are scattered from the anthers.
The flowering of the panicle is reached when 50% of the plants in a plot release pollen.
The silk formed on the ear emerges from the husks of the ear as a tuft of silky thread-like filaments (stigmas).
The phase is reached when 50% of the plants have visible silk on the ear. Depending on the hybrid, the opening of the anthers occurs 5-7 days before the flowering of the female flowers.
At flowering, the development of the vegetative apparatus is complete. The final number of leaves is reached, the leaf index and leaf area are at their maximum, and the plants have reached their maximum root penetration depth.
In electronic format, the number of instances in the flowering phase will be ideally recorded for each plot, as well as the percentage (%) of plants in the phase.
In this phase, the stigmas begin to dry and turn brown, while the husks remain green. The kernel has its final shape and size. It is pale yellow, and its content is milky, Figure 6.
The general appearance of the plant is optimally monitored on the 40 above-selected plants, and, if possible, investigations of the kernels will be made each time on other plants similar to those selected for phenological observations.
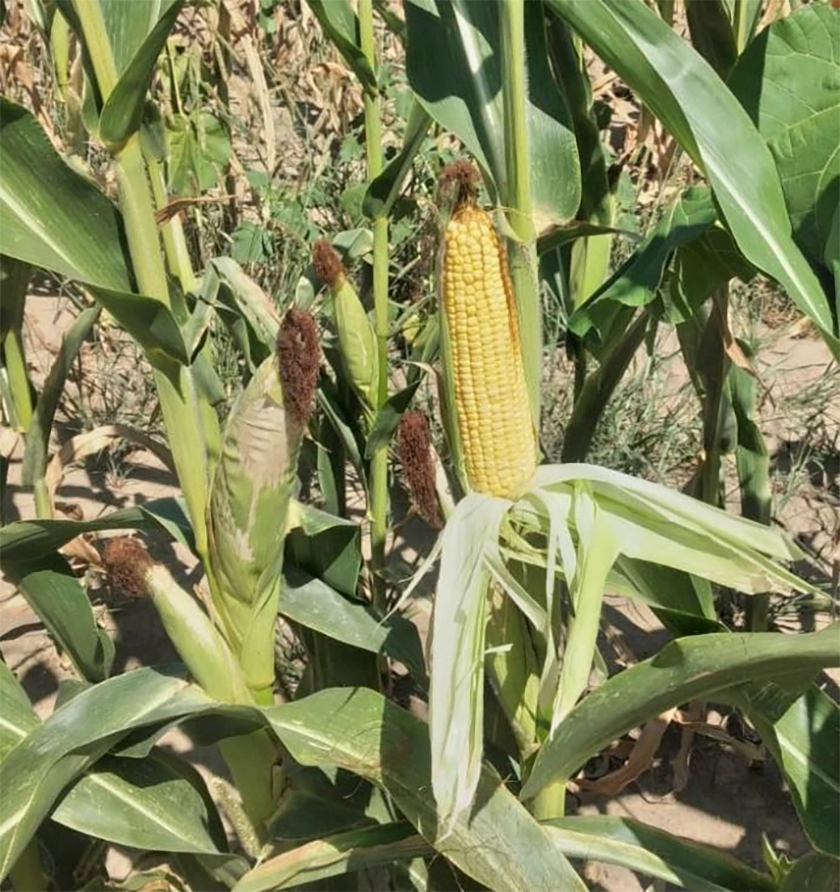
The kernel has a waxy consistency; it can be cut, but the content is solid.
In the soft dough stage, the moisture content of the kernel is 50-60%. The dry matter content of the plant is about 25%, and the leaves and husks begin to yellow.
In the hard dough stage, the kernel is yellow, it begins to harden, and the moisture content is 45- 50%.
The dry matter content of the plant reaches 30%. The lower leaves and husks begin to yellow.
In the glassy stage, the kernel is hard and has a moisture content below 40%. The dry matter content of the entire plant exceeds 35%. The leaves beneath the ear and the husks turn yellow.
In the electronic register, the data referring to the mentioned stages (in %), will be recorded if available (e.g. from the ASP).
The yellowed husks begin to detach from the ears, which start to bend. The kernels located in the middle of the ear are yellow, dry, and very hard, Figure 7.
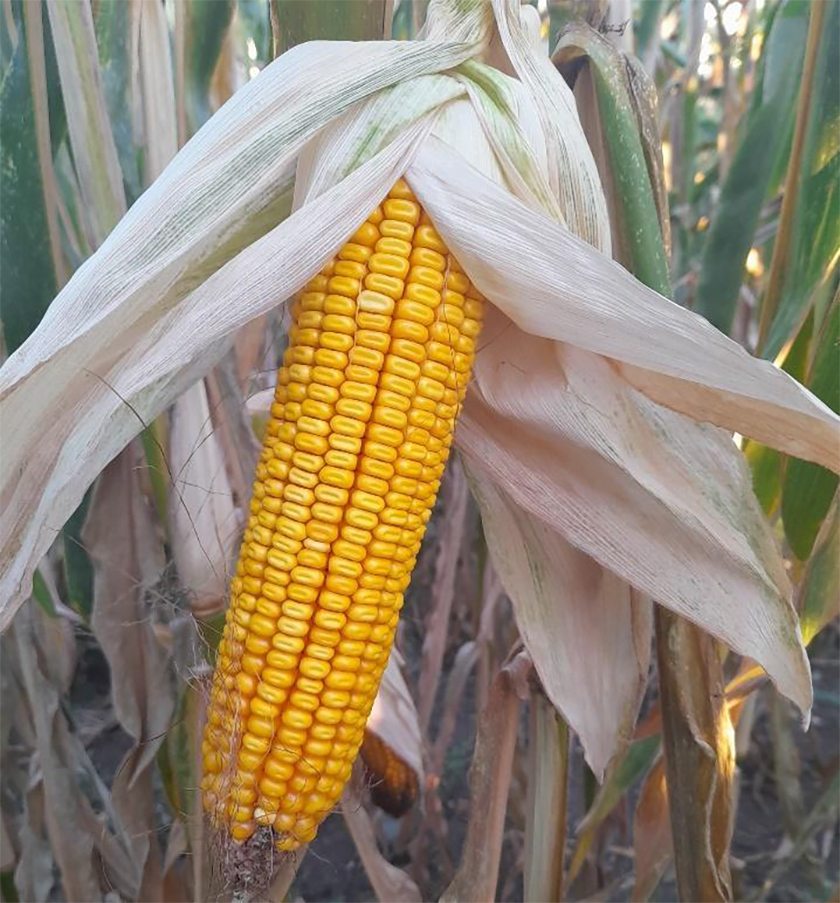
The most significant indicator for identifying full maturity remains the black layer The nodes and all the leaves have turned yellow.
Depending on the region, hybrid, and the moisture content of the kernel, the range is 25-35%, which is the most reliable indicator of full maturity, regardless of the color of the plants.
The maize crop can be affected by the following diseases:
The maize crop can be affected by the pests presented in Table 11.
Table 11. Maize crop pests
| Pest | Symptoms |
|---|---|
| Wireworms – Agriotes spp. | The adults are 7 to 12 mm long, reddish-brown or dark brown in color. On the ventral side of the thorax, they have a specialized organ that allows them to jump, producing a clicking sound—hence their common name, click beetles. The larvae, commonly known as wireworms, have a cylindrical body tapered at both ends, covered with a strongly chitinized integument. They are yellow-orange in color and can reach up to 25 mm in length. They have one generation every 4–5 years. Adults emerge at the soil surface in May– June and can be observed in active form until mid-July. They are usually crepuscular or nocturnal, but can also be seen in the morning, moving from one plant to another. They feed mainly on the pollen of umbelliferous plants. During this period, mating and egg-laying activity takes place. Egg-laying occurs in soils with high moisture content; to this end, females seek ground completely covered by vegetation, with a sufficiently moist surface layer to allow penetration into the soil at a depth of 1–5 cm. Eggs are laid individually or in small groups. They are sensitive to dryness. Newly hatched larvae are small, only a few millimeters long, white in color, and feed on humus. As they grow, they begin to feed on the fine, tender root branches. The larval stage lasts for 3–4 years. During their development, the larvae move both vertically and horizontally depending on moisture, temperature, and food availability. In autumn, they descend to a depth of 30–40 cm for overwintering, and in spring, they return to the upper soil layers. In summer, especially during extremely hot and dry periods, the larvae retreat to deeper layers. In addition to these climate-driven vertical movements, larvae also move horizontally in search of food. In the third or fourth year after hatching, depending on the species, the mature larvae pupate in July–August. After about three weeks, adults emerge, remaining in the soil in the pupal chamber over winter and until the following spring. Adults do not cause damage, but the larvae are extremely harmful and highly polyphagous. Among cereals, maize is the most affected by wireworm attacks, especially during seedling emergence and early growth stages. The larvae attack germinating seeds or newly formed roots. After sowing, larvae concentrate around maize kernels, gnawing the embryo and then penetrating the endosperm, often leaving only the seed coat intact. As a result, large gaps can be observed in crop emergence. The attack continues after plant emergence, with seedlings being gnawed at the collar region or root branching point. The leaves of affected plants turn yellow, wilt, and dry from the tip down, and the entire plant dies shortly thereafter. Surviving plants show severely delayed growth. Wireworm damage is typical in cold and wet springs, especially when sowing is deep and delays emergence. Under such conditions, even one larva per square meter can cause significant losses in maize crops. |
| Corn leaf beetle – Tanymecus dilaticollis Gyll | The ladybugs have an oval body, covered with gray-brown scales on the dorsal side and gray on the ventral side. The elytra have longitudinal stripes, darker in color than their background. The antennae are geniculate, the scapula not exceeding the posterior edge of the eye. The pronotum is wider than long, and the rostrum is widened, having a duckbill shape, hence the name duckweed. Body length: 6.5-8.0 mm. The eggs are oval-elongated, yellowish-white, 1 mm long, and the larvae are yellowish-white, apodous, recurved, with the body provided with folds and yellowish pubescence. The head and the last abdominal segment are gray-brown. Body length: 8-10 mm. When corn plants have 2 leaves, they are cut off by weevils, and when they are past two leaves, they are eaten starting from the edge towards the main vein. It has one generation every two years. |
| European corn borer – Ostrinia nubilalis | It is a polyphagous insect, but it causes the most damage in maize crops. The small larvae feed on leaves or tassels. On the leaves, small holes can be observed, sometimes arranged linearly due to the leaf being perforated at the whorl stage. On the tassels, larvae chew the stamens and perforate the branches and peduncle of the tassel, which easily breaks during wind and rain. The attack on the male inflorescences affects the pollination process. Greater damage is caused by more developed larvae, which tunnel into the stalk or the peduncle of the ears. Around the holes, usually there are piles of sawdust colored white-yellowish-brown. One or more holes can be seen on a single stalk, starting from the upper internodes downwards, corresponding inside to irregular galleries of various sizes. These cavities and damages hinder plant development and cause breakage of numerous stalks or ears, often resulting in shriveling of the kernels and thus reduced yield. Stalk and ear breakage create favorable conditions for fusarium infection. It should be noted that stalk breakage causes major difficulties during mechanical harvesting of maize. The moths have a wingspan of 25–30 mm in females and 20–25 mm in males. The color is light yellow in females and brown-gray in males. The eggs are flattened, white, and smooth, with the oviposition resembling a drop of wax. The mature larva has a whitish-gray body, sometimes pinkish, measuring 20–25 mm in length. The corn borer overwinters as a mature larva inside the stalks of the host plants. |
| Western corn rootworm – Diabrotica virgifera virgifera | The adult is yellowish-green in color, with a body length between 4.2 and 6.8 mm. The female has three symmetrical stripes on the wings, a larger abdomen, and shorter antennae compared to the male. The male’s abdomen is blunt, while the female’s is more pointed. The egg is light yellow, oval, and 0.5 mm long. The larva is thin, elongated, white with a black head, reaching a body length of 13 mm at maturity. The larvae feed on the roots of several grass species (sorghum is not a suitable host due to its hydrocyanic acid content), but maize is the most important host plant. The larvae are attracted to maize roots and are capable of reaching the root system even when the maize rows are 100 cm apart, meaning they can move about 50 cm. Larvae feed on roots, with the third instar larvae being the most dangerous. Initially, after hatching, larvae feed on root hairs and the outer cortical tissue. As the larvae grow, their food requirement increases, and they hide in the cortical parenchyma, progressively moving toward the root growth zone. Through feeding, the larvae cause wounds on the roots, penetrate them, and may sever roots. The integrity of the root system is affected, and individual roots or entire root nodes may be destroyed. Feeding on roots adversely affects plant growth and development. Due to larval feeding, plant stability is reduced, and lodging can occur. In heavy infestations, plants typically have leaning stalks, are poorly anchored in the soil, and are easily knocked down by storms and heavy rains. Heavy rains may be followed by partial regeneration of the root system and straightening of fallen plants. Lodging can be severe if drought occurs during June. Severely attacked plants wilt and dry out prematurely. Larval root feeding reduces water and nutrient uptake by the plant, resulting in a significant reduction in grain yield. Mechanical harvesting of lodged plants is also difficult. Adults are polyphagous but typically feed on leaves, pollen, and silk, and later on the tips of maize ears. Young adults initially feed on leaves, causing whitish longitudinal stripes similar to those produced by Lema melanopa adults. During maize flowering, adults feed on pollen and silk, and after flowering, on silk residues and kernels at the tip of the ears in the milky stage. |
| The cutworm – Scotia segetum | The mature larvae reach up to 40 mm in length, with a lead-gray color and a metallic sheen. They usually have two generations per year, overwintering as larvae in the soil at a depth of 20–30 cm. They cause significant damage, typically in floodplain areas. Maize plants can be attacked from emergence until they reach the 8–10 leaf stage. When plants are in the early growth stage, feeding around the crown is total or nearly total, followed by the collapse of plants in the row. Later, when plants are in a more advanced growth stage, the larvae are unable to sever the plants but instead perforate the stalk above the crown and tunnel a gallery 3–4 cm long inside the stalk. As a result of the attack, the central leaf withers and gradually the entire plant dries out. Sometimes, due to feeding wounds at the base of the stalk, the plants break completely or grow crooked. |
| Frit Fly – Oscinella frit | The larva is cylindrical, slightly flattened, yellowish-white in color, measuring 4–5 mm in length. The insect has 2–3 generations per year and overwinters as a fully developed larva or pupa, mainly in autumn cereal crops. Larvae of the spring generation infest young plants at the 2–4 leaf stage. Infested plants show stunted growth, with a process of tillering and thickening near the crown area. Often, leaf emergence is hindered, causing the plants to bend like crutches, and the tassel does not develop. The exposed leaves have perforations arranged in transverse rows. |
| Steppe beetle – Anoxia villosa May beetle – Melolontha melolontha | The larvae have a bulky, slightly curved body, measuring 40–50 mm in length, and are yellowish-white in color. The steppe beetle has one generation every three years and overwinters as a larva in the soil, while the May beetle has one generation every four years and overwinters as a larva and, in the last year, as an adult in the soil. Particularly in the case of the steppe beetle, the larvae frequently attack maize, completely destroying the roots. The attack appears in patches. In cases of large infestations, the entire crop can be compromised. The attack begins in spring, from May, and continues until autumn. Root system feeding can lead, depending on the larval density, to plant death or weakening, and consequently to a reduction in the potential yield. |
| Black corn beetle – Pentodon idiota | The adult has a massive body, black in color, with a length of 14–22 mm. It has one generation every three years. Adults appear at the end of April to the beginning of May. Damage is caused by the adult, which during seedling emergence and early growth stages destroys the stems by gnawing them just below the soil surface for about 2 cm in length. The central leaf withers and dries, and the plants break. |
| Green corn aphid – Rhopalosiphum maidis | The distribution and damage area is closely linked, primarily, to the cultivation of maize and sorghum. The aphids feed mainly on the growing parts of the plant, in the whorl of the central leaf, under the leaf sheaths, on the panicles during their emergence, on the silk, or on the inner side of the spikelets. On the attacked parts, large amounts of honeydew and sooty mold |
This workflow delivers field-scale, BBCH-aligned phenology for winter wheat and maize in the Danube region using only operational satellites available in 2025. Optical core data come from Sentinel-2 MSI (10 m, nominal 5-day revisit) merged with Harmonized Landsat-8/9 (30 m, combined 8-day), while microwave continuity is secured with Sentinel-1 C-band SAR (VV, VH, ~10 m, 6-day).
After atmospheric correction, all scenes are clipped to official LPIS field boundaries; per-field medians suppress mixed-pixel noise in the fragmented parcels of areas of interest. Optical images yield NDVI, EVI, red-edge NDVI, NDWI, and chlorophyll-sensitive MCARI; radar backscatter and the VH/VV ratio capture canopy structure and moisture. Dense time series are smoothed with a Savitzky-Golay filter (window <15 days) to reduce residual cloud artifacts and speckle without distorting inflection points.
Phenological markers are then extracted automatically:
Where available, a simple thermal-time model (growing-degree-days from ERA5-Land) is assimilated with satellite breakpoints via an Ensemble Kalman Filter, correcting small cultivar or
management shifts and routinely achieving ±2-4 day accuracy against phenology field records. Without the model, pure satellite signals still resolve major stages within ±5-7 days, adequate for scheduling fungicide at heading, optimizing irrigation cut-off, and planning harvest logistics.
Using this remote sensing-based method for assessing the BBCH-scale, the above Tables should be completed as follows. In Tables 3, 8, 9, and 10, only the (phenological) phase and % (plants that entered the phase) columns will be filled. In Table 4, only the estimated growth increase will be provided. In Table 5, only the column % (number of plants) will be provided.
If available, Sentinel-1 fusion, field-level aggregation, and threshold tuning can be used for local refinement of resolution, with a handful of ground observations.
The entire workflow presented in this section can be executed in Google Earth Engine or Sentinel Hub within hours for thousands of fields.
Visual observations of the soil refer to the assessment of the soil’s water supply in the surface layers and in depth, the degree of loosening of the arable layer, compaction, crust formation on the soil surface, and the appearance of cracks as a result of a strong decrease in moisture content. During winter, visual observations are carried out on soil freezing and thawing.
These visual observations complement information obtained through instrumental measurements by visually estimating the conditions for performing mechanized agricultural works, such as soil preparation for sowing, crop maintenance works (soil loosening, fertilization, or phytosanitary treatments, etc.).
At the same time, visual estimation of the degree of soil water supply at the surface allows evaluation of the current and prospective vegetation conditions.
Observations carried out during winter on soil freezing and thawing provide the basis for assessing the overwintering conditions of autumn crops and the degree of soil loosening through the alternate freezing-thawing processes.
All visual observations regarding the soil moisture status are carried out on four plots (replicates) of the platforms. The visual estimation of soil moisture, the conditions for agricultural works, and the water supply to plants is done using 5 classes rated from 1 to 5, depending on the soil consistency.
The degree of soil moisture determined visually, both at the surface (0–2 cm) and for the arable layer (10–15 cm), is recorded on a scale from 1 to 5. When recording the values for the four replicates, rounding is applied as in the example: instead of 3.5, 4 is recorded; instead of 3.25, 3 is recorded.
Scales for the degree of soil moisture determined visually:
Visual observations on the degree of soil freezing are carried out on the observation platforms of the respective crops. These observations are made when the air temperature drops below -15°C. For this purpose, a pit 20 cm deep is dug, from which a soil sample is taken and the soil’s resistance to cutting, pressing, and the size of the ice crystals are studied. The soil is analyzed at 0–2 cm and at 10–15 cm depths, or in special cases, only at a single depth.
Depending on the soil’s resistance to cutting and the presence of ice crystals, the soils are classified as follows:
Axinte, M.,, Roman, G. V.,, Borcean, I., Muntean L. S., (2006) Phytotechnics, 4th edition “Ion Ionescu de la Brad” Publishing House, Iaşi;
Bărbulescu, A., Popov, C., Mateiaş, M. C., (2003) Diseases and pests of field crops, Ceres Publishing House, Bucharest;
Bâlteanu, G., (2001), Phytotechnology, vol. 1, Ceres Publishing House, Bucharest;
Berbecel, O., Stancu, M., Ciovică, N., Jianu, V., Apetroaei, Şt., Socor, E., Rogodjan, I., Eftimescu, M., (1970), Agrometeorology, Ceres Publishing House, Bucharest;
Berbecel, O., Socor, E., (1982), Agrometeorological Guide, Institute of Meteorology and Hydrology Publishing House, Bucharest;
Budoi, G., Penescu, A., (1996), Agrotehnica, Ceres Publishing House, Bucharest; Canarache, A., (1990), Physics of agricultural soils, Ceres Publishing House, Bucharest;
Hack, H., Bleiholder, H., Buhr, L., Meier, U., Schnock-Fricke, U., Weber, E., Witzenberger, A. (1992). Einheitliche Codierung der phänologischen Entwicklungsstadien mono- und dikotyler Pflanzen. Erweiterte BBCH-Skala, Allgemein. AGRIS – International System for Agricultural Science and Technology 44, 265–270. URL: https://agris.fao.org/search/en/providers/125095/records/67a0a50d20478411b025d6ee
Mateescu, E., Alexandru, D., Oprea, O.A., Manea, A., (2016). Instructions for meteorological stations: Agrometeorological guide, National Meteorological Administration, Bucharest.
Motoc, M., (1963), Soil erosion on agricultural lands and its control, Agro-silvică Publishing House, Bucharest;
Meier, U., (2001). Growth stages of mono- and dicotyledonous plants: BBCH Monograph (2nd ed.). Federal Biological Research Centre for Agriculture and Forestry;
Meier, U. (Ed.), (2018). Growth stages of mono- and dicotyledonous plants: BBCH Monograph, Botanical sciences. Open Agrar Repositorium, Quedlinburg, Germany. https://doi.org/10.5073/20180906- 074619
Rosenberg, N.J., Blad, B.L. Verma, S.B., (1983), Microclimate: The Biological Environment, Second edition, New York, John Wiley and Sons;
Zamfirescu, N., Velican, V., Săulescu, N., Safta, I., Canțăr, F., (1965), Phytotechnology, Vol. II, 2nd Edition, Agro-Silvică Publishing House, Bucharest;
Wieringa, J., (1998), Climatological use of station network data. In: Proceedings of Seminar on Data Spatial Distribution in Meteorology and Climatology, 28 September–3 October 1997, Volterra, Italy. EUR 18472 EN. Luxembourg, Office for Official. Publications of the European Union;
WMO-No.8, (2008), Guide to Meteorological Instruments and Methods of Observation; WMO-No.134, (2010), Guide to Agricultural Meteorological Practices;
WMO-No.266, (1984) Compendium of Lecture Notes for Training Class IV Meteorological Personnel. Vol. II: Meteorology;
WMO-No.544, (2003), Manual on the Global Observing System. Vol. I;
WMO-No.551, (2001), Lecture Notes for Training Agricultural Meteorological Personnel;
***Archive of agrometeorological information and bulletins, managed by the Agrometeorology Service, National Meteorological Administration Bucharest;
***Agrometeorological database of the National Meteorological Administration, managed by the Agrometeorology Service.